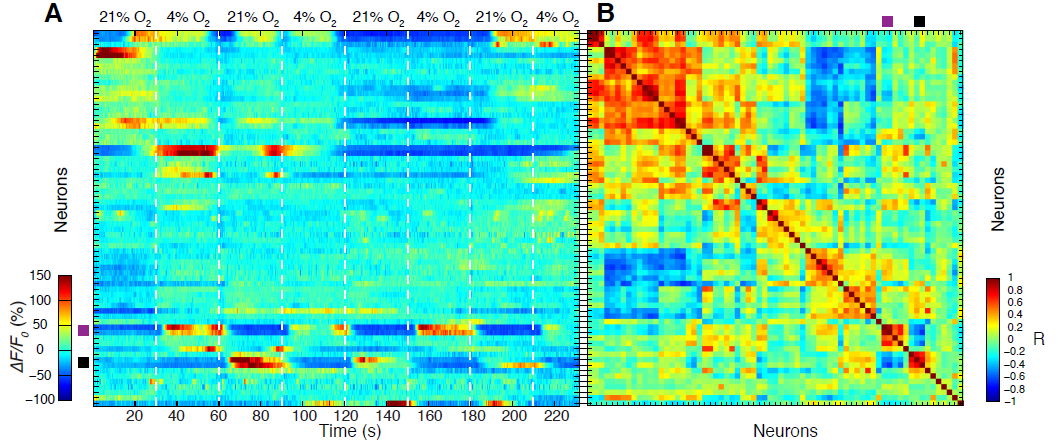
Wide-field temporal focusing (WF-TEFO) is a two-photon imaging technique which is based on light-sculpting. It effectively decouples the parameters governing lateral size of a light beam and its axial resolution. Thus, this techniques allows exciting a large area in the lateral dimension while retaining exceptional resolution in the axial direction. In an actual setup, this is akin to creating a thin “disc” of excitation light. WF-TEFO is well suited for fast volumetric imaging, as it scanning is reduced to one dimension only.
In our latest experiments we tailored the properties of our WF-TEFO to record, with high temporal and spatial resolution, the activity of neurons in the head ganglia of C. elegans in vivo using Ca2+ imaging. Read below the abstract of our paper:
Recent efforts in neuroscience research seek to obtain detailed anatomical neuronal wiring maps as well as information on how neurons in these networks engage in dynamic activities. Although the entire connectivity map of the nervous system of C. elegans has been known for more than 25 years, this knowledge has not been sufficient to predict all functional connections underlying behavior. To approach this goal, we developed a two-photon technique for brain-wide calcium imaging in C. elegans using wide-field temporal focusing (WF-TEFO). Pivotal to our results was the use of a nuclear-localized, genetically encoded calcium indicator (NLS-GCaMP5K) that permits unambiguous discrimination of individual neurons within the densely-packed head ganglia of C. elegans. We demonstrate near-simultaneous recording of activity of up to 70 % of all head neurons. In combination with a lab-on-a- chip device for stimulus delivery, this method provides an enabling platform for establishing functional maps of neuronal networks.

To aid in cell segmentation, we use transgenic worms expressing the Ca2+-sensor GCaMP5K in a pan-neuronal and nucleus- bound fashion. We also used custom-designed microfluidic devices to restrain the worms while applying chemosensory stimuli. Using this approach, we demonstrate brain-wide and near-simultaneous Ca2+– imaging of 70 % of the neurons contained in the head ganglia.

The spatial and temporal resolution of our imaging technique is adequate for investigating global properties of the C. elegans nervous system, such as correlated activity among groups of neurons and their responses to sensory stimuli. This paves the way for future investigations on how sensory information is processed at the level of the whole brain, and for establishing a functional map of C. elegans’ nervous system and potentially also in other model organisms.

Below is a 3D-Movie of a C.elegans brain acquired by WF-TEFO. Activation of pairs of BAX and URG neurons is clearly visible in the mid left and top right, respectively, as oxygen is up and downshifted from 4 to 21 %. Videos like this were used to track activity of individual neurons and produce plots like the one above.
Relevant Publications:
Schrödel, Tina*; Prevedel, Robert*; Aumayr, Karin; Zimmer, Manuel and Vaziri, Alipasha (*Co-First Authors),
Brain-wide 3D imaging of neuronal activity Caenorhabditis elegans with sculpted light
Nature Methods 10, 1013–1020 (2013).
(Download)
