
Our paper entitled “A versatile platform for two-photon neuronal population voltage imaging across cortical depths” has been published in Nature Methods. This work details our new Flexible lateral-temporal Multiplexing (FlatMux) method for populational voltage imaging—an emergent modality that reports membrane potential directly.
The imaging of neuronal population activity in awake mice is typically based on monitoring the Calcium activity in neurons, which is only a proxy to the neuron activity and does not provide faithful information of neuron activity. For example, the slow kinetics of the indicators sensing Calcium activities are too slow to capture single action potentials. Meanwhile, sub-threshold information is lacking. Voltage imaging, utilizing indicators that are sensitive to membrane potential, offers direct measure of neuron activity and therefore it provides unique opportunities in neuroscience study. However, performing voltage imaging on a population of neurons also posts a significant challenge in the optical microscope realization due to the high-speed required to resolve single action potential, the intrinsically low signal-to-noise ratio (SNR) for the limited number of fluorophores per neuron, and relatively fast photobleaching.
We tackled these challenges by designing and implementing a novel spatio-temporal multiplexing scheme. In our scheme, an array of “light beads”—individual beams which are separated in time and focus onto different spatial locations—is generated from a single laser pulse through a re-imaging cavity based on 4 concave mirrors. Each round trip around the cavity, a delay and a lateral offset is added, and one of the light beads is coupled out. These light beads are then relayed to and scanned on the sample—each light bead arrives at the sample at a different time and different lateral location. Due to the lateral separation of the light beads, each of the light beads scans a distinct area on the sample, creating an image of a small field of view (FOV) in each frame. The temporal separation allows distinguishing the signal generated by each light bead. Therefore, we can stitch these small FOVs together to form a large FOV, allowing high-speed populational neuron imaging. Such a scheme also operates at the single-pulse-per-pixel regime—pulses are non-overlapping on the sample within each frame—maximizing the SNR per neuron for the same optical power while minimizing photobleaching.
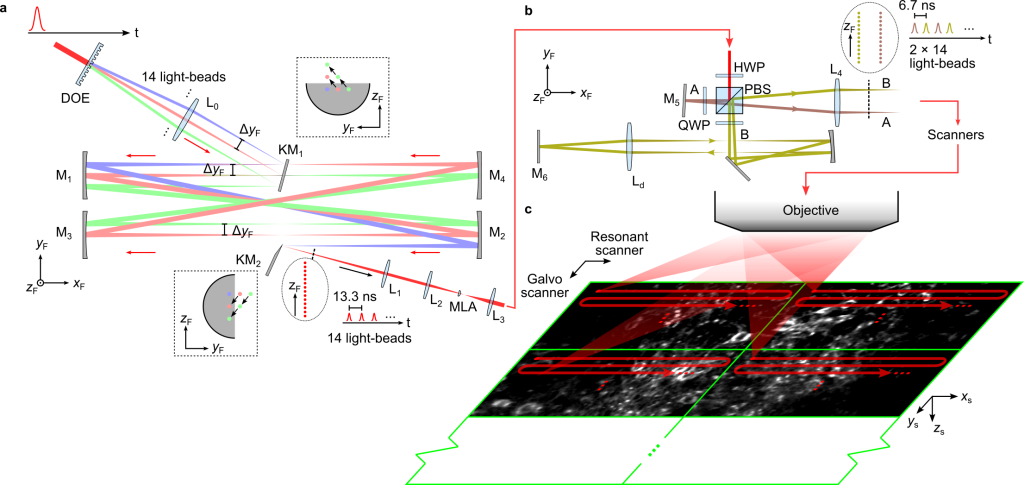
Figure 1 | FlatMux schematics. (a) A high-energy laser pulse is split into 14 light beads by a diffractive optical element (DOE) and enters a cavity based on 4 concave mirrors. Each light bead is delayed and displaced in the cavity with respect to each other. At the output, 14 light beads are spatially and temporally separated. (b) A module to double the 14 light beads to 28. (c) On the sample, each light bead scans a distinct, small FOV. Stitching all the small FOVs forms a large FOV of 590 × 400 μm2.
Using FlatMux, we demonstrated various modalities, all achieving voltage imaging over a large population of neurons in awake mice. These include a large-FOV mode capable of recording a FOV of 590 × 400 μm2 at 750 Hz, a high-speed mode with a FOV of 375 × 200 μm2 at 2 kHz, a deep-tissue imaging mode with a FOV of 590 × 200 μm2 at 750 Hz and 500 μm depth, and a high-SNR mode which allows ~10× improvement in fluorescent photon number compared our alternative FlatMux modalities.
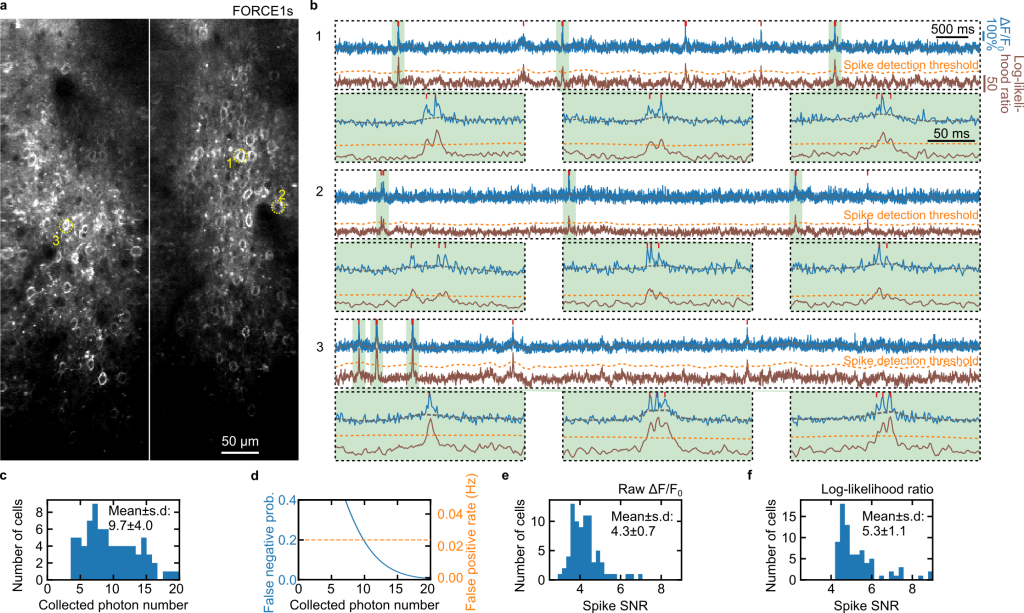
Figure 2 | Large Field of View (FOV) mode: An example recording with the large-FOV mode. FOV: 590 × 400 μm2. Frame rate: 750 Hz. (a) Mean intensity projection of the FOV. (b) Example traces of three neurons showing clearly resolved spikes. Short red lines: detected spikes.
Video 1 | Whisker stimulation and real time GEVI recording: Behavior video during an example recording with the large-FOV mode. Whisker stimuli were applied. The timing relation among the presentation of whisker stimuli (marked by short white vertical lines on the top), the whisker angles, and the spike rate during the recording are shown on the right. Correlation between spikes and whisker stimuli can be clearly seen. Yellow dashed line indicates the current displayed frame in the video.
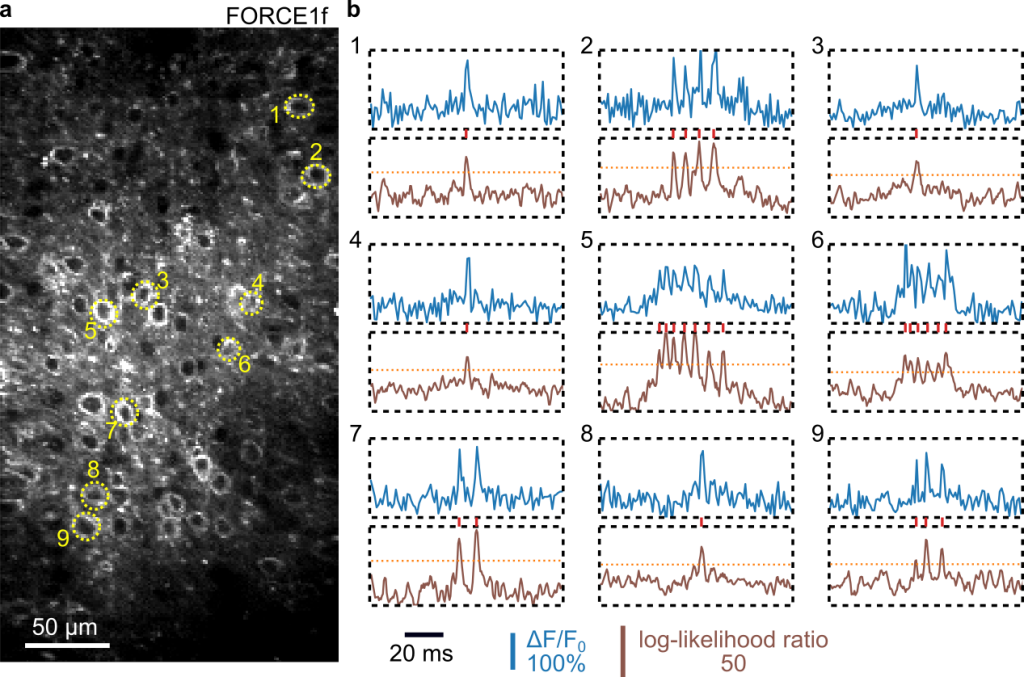
Figure 3 | High speed mode: An example recording using FlatMux’s high-speed imaging mode. FOV: 375 × 200 μm2. Frame rate: 2 kHz. (a) Mean intensity projection of the FOV. (b) Example traces of nine neurons showing clearly resolved single spikes or bursts of spikes. Short red lines: detected spikes.
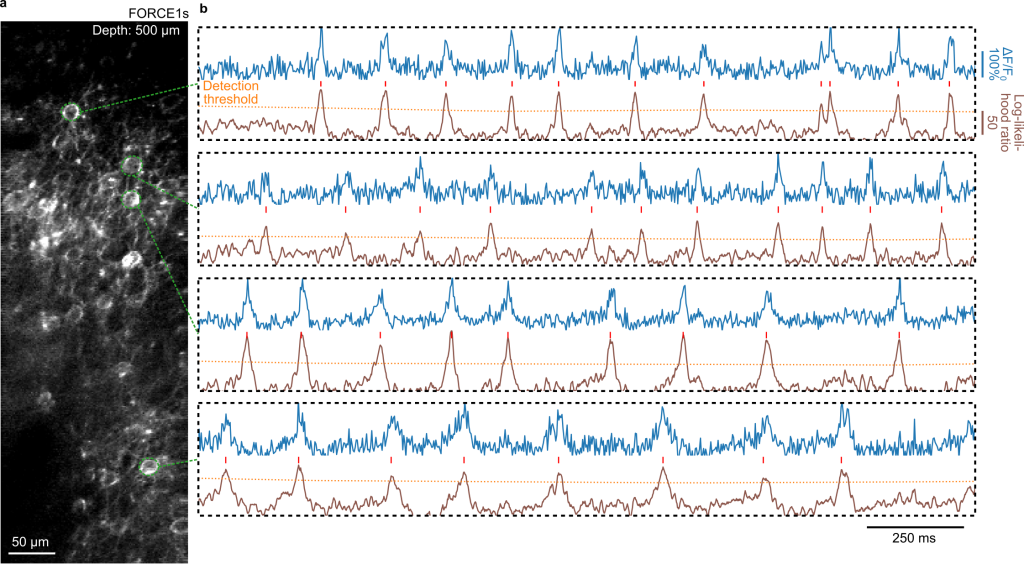
Figure 4 | Deep tissue mode: An example GEVI recording of a plane at 500 μm (layer 5) depth using FlatMux’s deep-imaging mode. FOV: 590 × 200 μm2. Frame rate: 750 Hz. (a) Mean intensity projection of the FOV. (b) Example traces of four neurons showing spikes or burst of spikes. Short red lines: detected spikes.
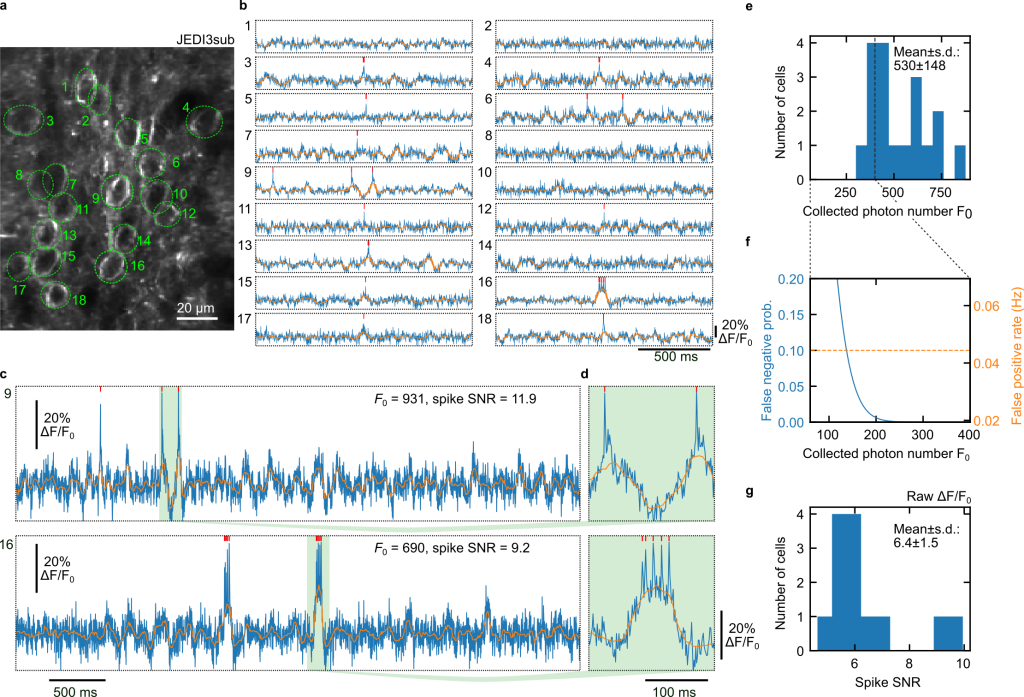
Figure 5 | High signal to noise ratio (SNR) and sub-threshold imaging mode: An example recording with high-SNR mode. FOV: 112 × 140 μm2. Frame rate: 750 Hz. (a) Mean intensity projection of the FOV. (b) Example traces of the 18 neurons showing both spikes and subthreshold activity with high SNR. (b) Zoom in of two example traces, showing two single spikes and a burst of spikes. Short red lines: detected spikes.
We also realized a dual-plane imaging mode which allowed simultaneously probing neurons at two different layers, one at cortical layer 2/3 and one at layer 4. When applying sensory stimuli, we observed that the neurons at layer 4 spikes, in response to the stimuli, earlier than the neurons at layer 2/3 by ≲3 ms.
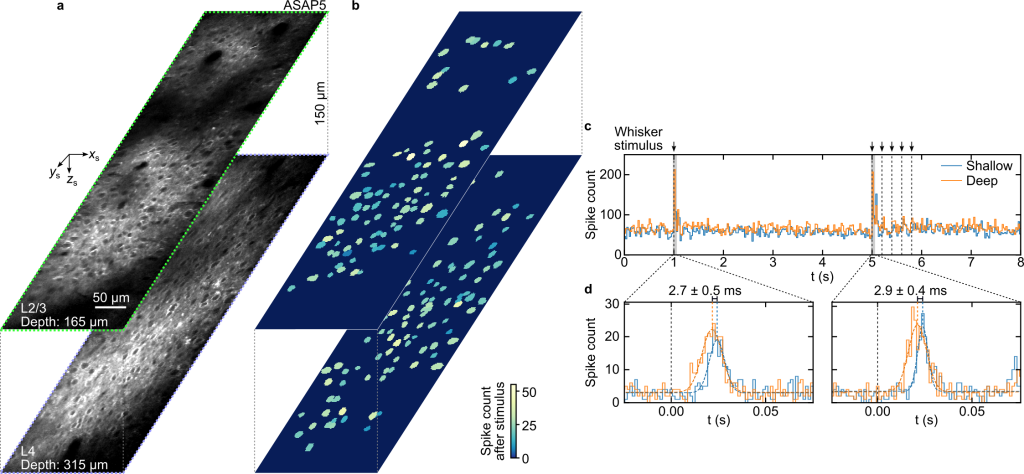
Figure 6 | Dual plane imaging mode: An example recording showing simultaneous recording of layer 2/3 and layer 4 mouse cortical neurons using FlatMux’s dual plane imaging mode. Whisker stimuli were applied while FOVs, each 590 × 200 μm2 located at 165 µm and 315 µm respectively were imaged at 750 Hz. (a) Mean intensity projection of the FOV, one at layer 2/3 and one at layer 4. (b) Histogram of all detected spikes in both cortical layers across neurons and trials, showing strong increase of spike count after the application of whisker stimuli. (c) Spike count histograms after the first and the second whisker stimulation. Fits with Gaussians (dashed lines) show delayed firing of neurons in the shallower layer 2/3 by ~3 ms compared to those in the deeper L4. Displayed values: mean ± s.e.
The above results showcase the capabilities of FlatMux and demonstrate some example biological questions that can be studied with it. It opens up new possibilities in neuroscience study by allowing recording of single spikes over a large population of neurons.
Relevant Publication:
J. Guo, K. Barber, M. A. Frechou, S. Lu, J. Demas, D. Chen, S. Yang, A. J. McDonald, M. A. Land, F. St-Pierre and A. Vaziri, A versatile platform for two-photon neuronal population voltage imaging across cortical depths, Nature Methods 23, 1622-1636 (2026), doi: 10.1038/s41592-026-03158-y
https://www.nature.com/articles/s41592-026-03158-y